Please visit the website to interactively explore all visualizations at: https://davidxie.shinyapps.io/US-Medical-Insurance/
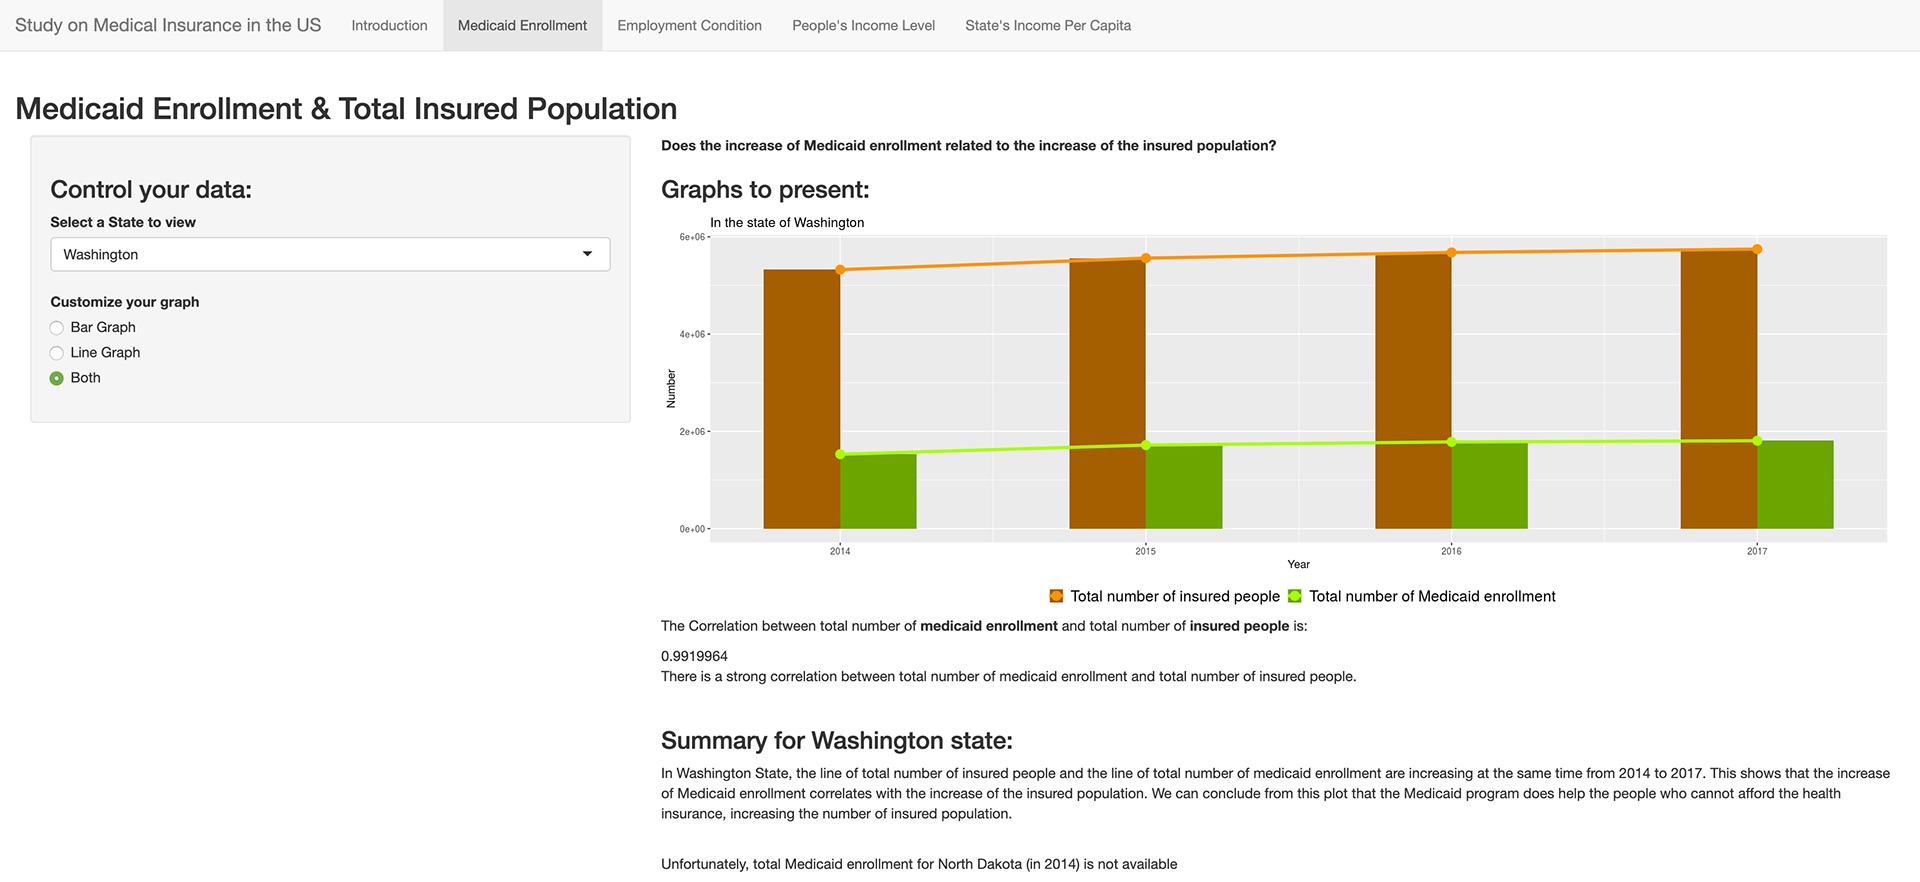
Medicaid Enrollment & Total Insured Population
![](https://pro2-bar-s3-cdn-cf3.myportfolio.com/786cb39b270356ef830a84026c005e62/ec5f64db-b1ee-4e79-b948-ea6e71b33c86_rw_1920.png?h=5c2372cabcd3622c3b51c1e2ab67d1a7)
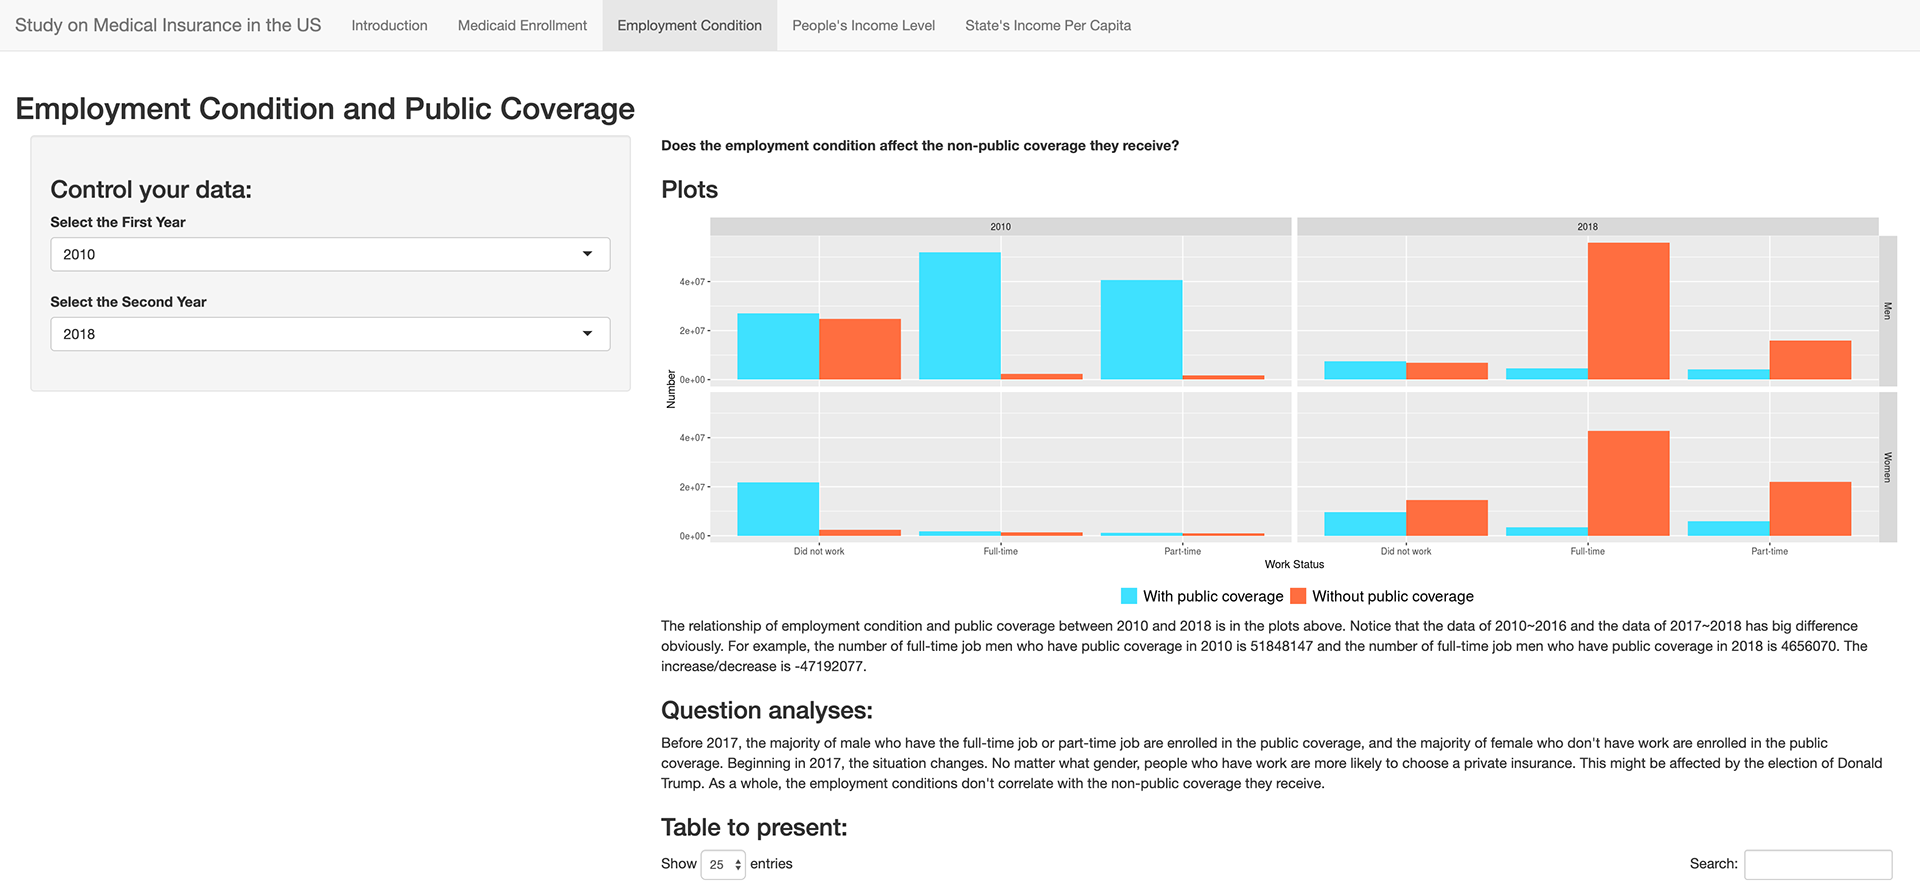
Employment Condition and Public Coverage
![](https://pro2-bar-s3-cdn-cf2.myportfolio.com/786cb39b270356ef830a84026c005e62/3f35fc44-495e-4331-a3a1-5e4f1d379336_rw_1920.png?h=ef9590272e9ad7c3a9b3ca6d94666474)
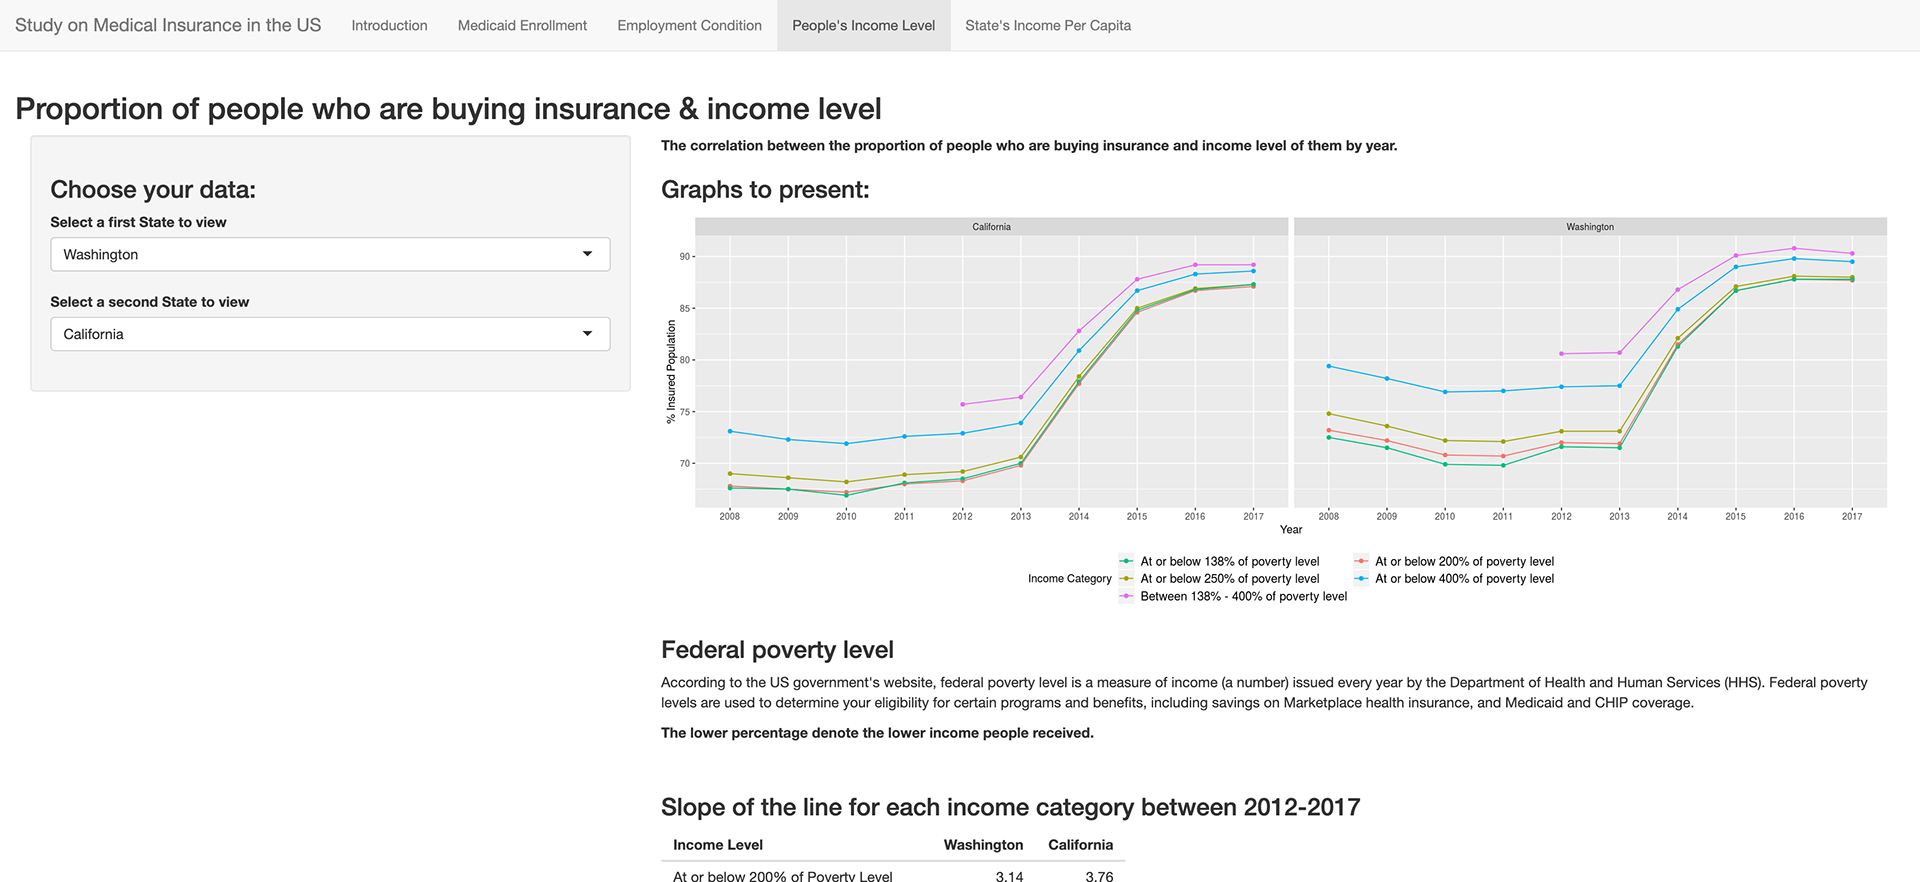
Proportion of people who are buying insurance & income level
![](https://pro2-bar-s3-cdn-cf4.myportfolio.com/786cb39b270356ef830a84026c005e62/593152f4-bac3-4505-86a4-81f1c5f43d15_rw_1920.png?h=25e80de2c21f5956d2e3452dc3778be2)
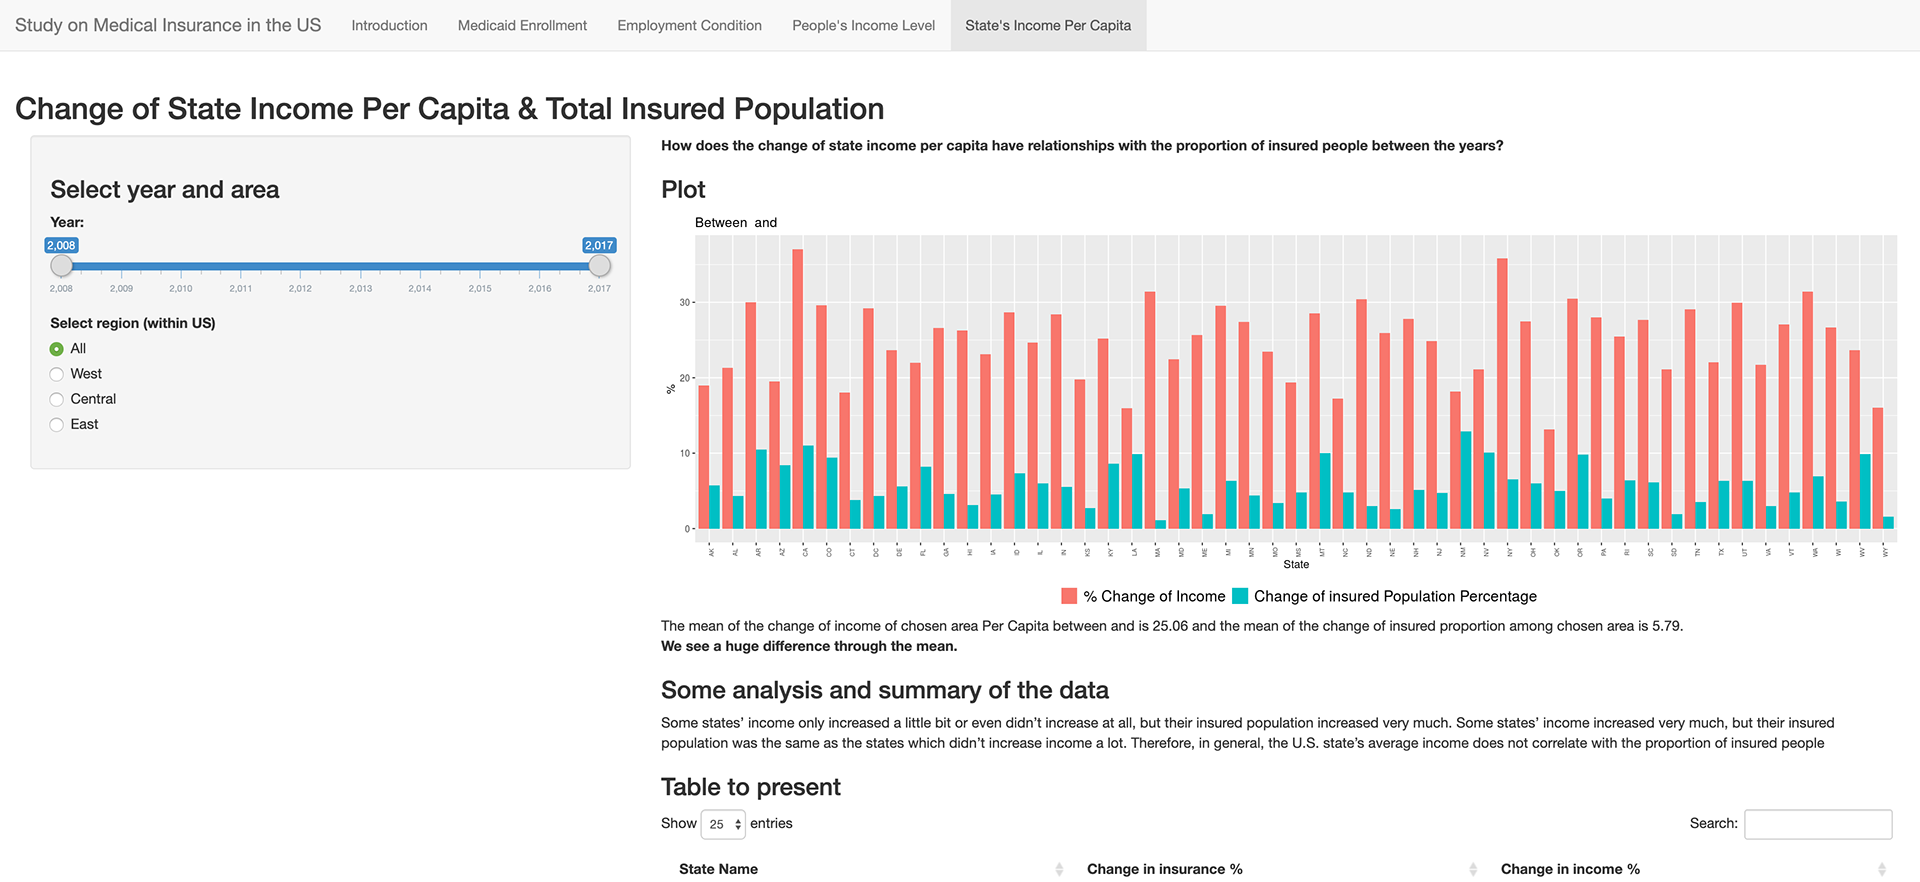
Change of State Income Per Capita & Total Insured Population
![](https://pro2-bar-s3-cdn-cf5.myportfolio.com/786cb39b270356ef830a84026c005e62/60b79a3d-7440-4c4e-82b7-50751f6a31f7_rw_1920.png?h=de16d5516cc0853950024688c96baf9a)
Datasets (Works Cited):
Since this contains Medicaid Enrollment every month, we use June for each year.
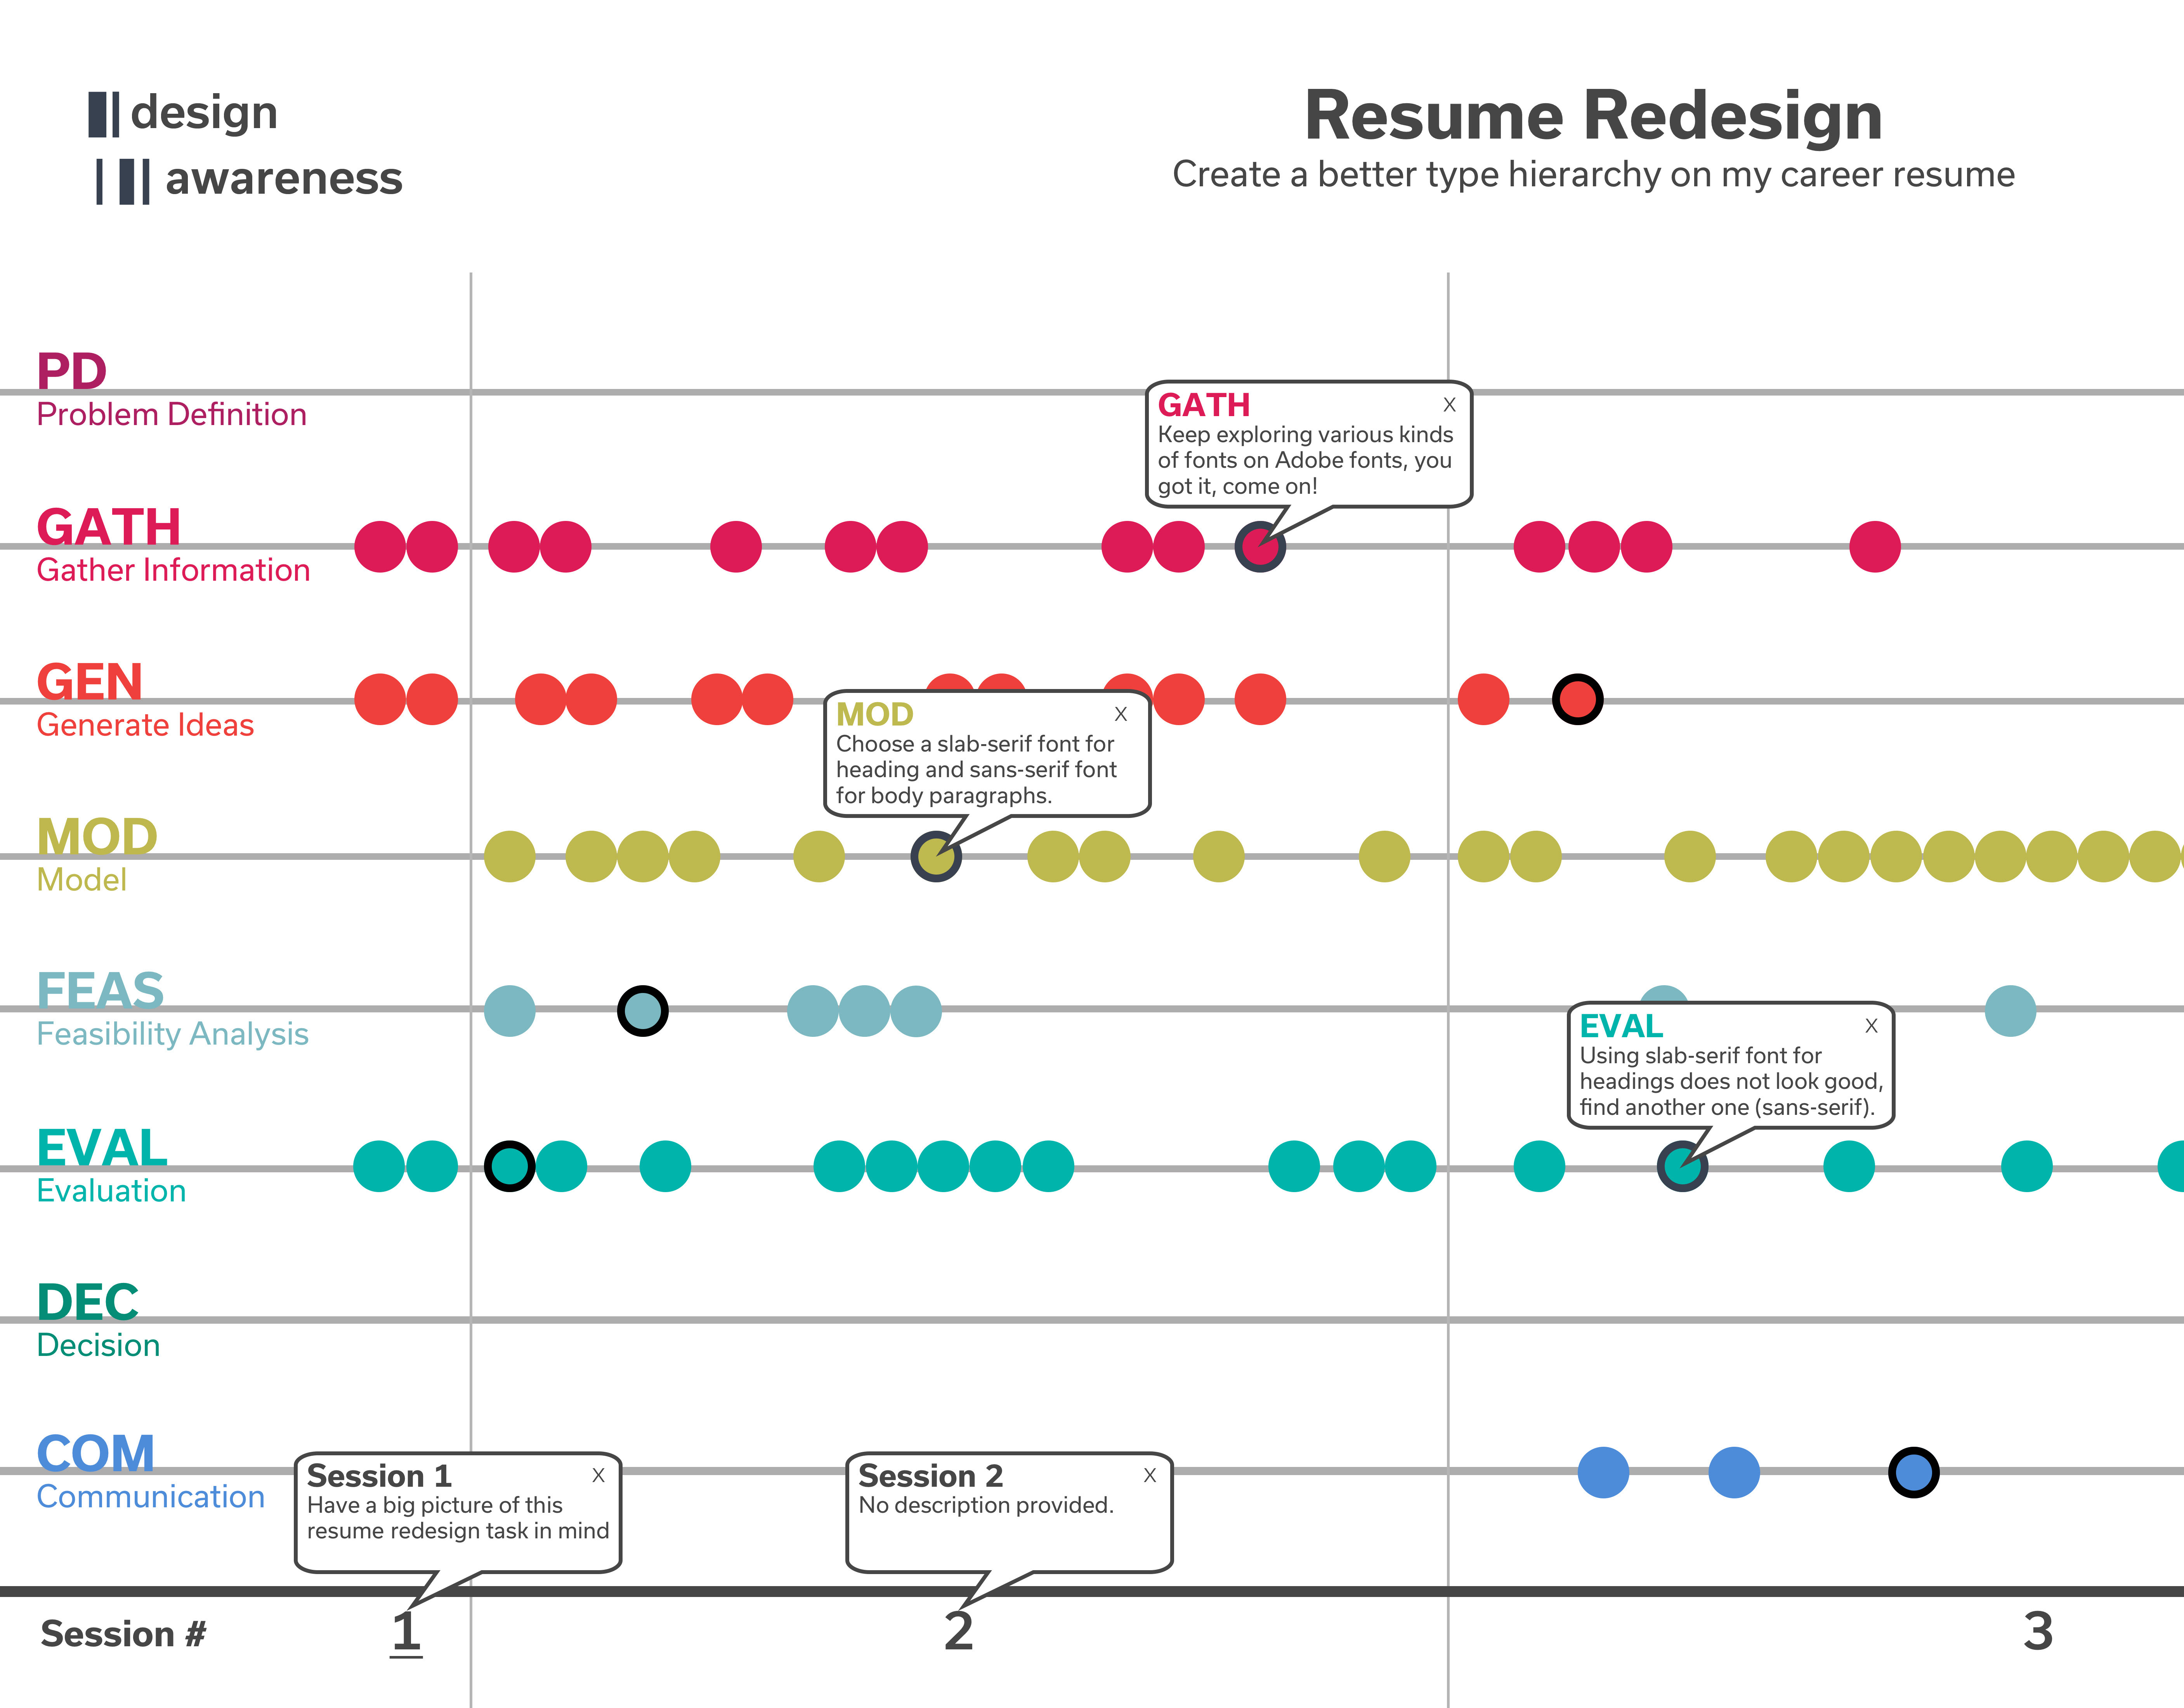
Group Project Roster:
Tsz Ming Wong, David Xie, Louise Tang, and Zhitong Lin